
My school is a 1:1 iPad school and we are all about tracking data. We give common assessments every 3 weeks and set goals for our kids based off of what they score on their assessments. We even have data spreadsheets that we have to update every three weeks to submit to our principal. For my classroom, I take data a step further and have my kids track their progress by standard. This is where My all time favorite app, TAPit, comes to play.
TAPit, or the answer pad, has two components to it - a live interactive portion and a data portion. I'm going to brag on the data portion for tonight since I have pictures to show. TAPit is like a digital bubble sheet for the kids to record their answers. The awesome thing about this is the teacher can go to www.theanswerpad.com and set up an answer sheet. It can be multiple choice, true/false, or open response.

Setting up an answer sheet.

How it looks like when you want to set up an answer sheet for multiple choice answers.

The best part - you can assign each question with a particular common core standard!
I love being able to assign each question with a standard because this is what I look at when I'm having my kids track their data. When students put their answers in, the data that it provides teachers is phenomenal! Take a look! My kids took an assessment yesterday!

You can look at the data three ways - look at the results (test grade), look at the analysis (item analysis, being able to see what questions students missed or got correct), and proficiency (gives you a cool looking graph to see which kids fall into needing intervention or which students are advanced).
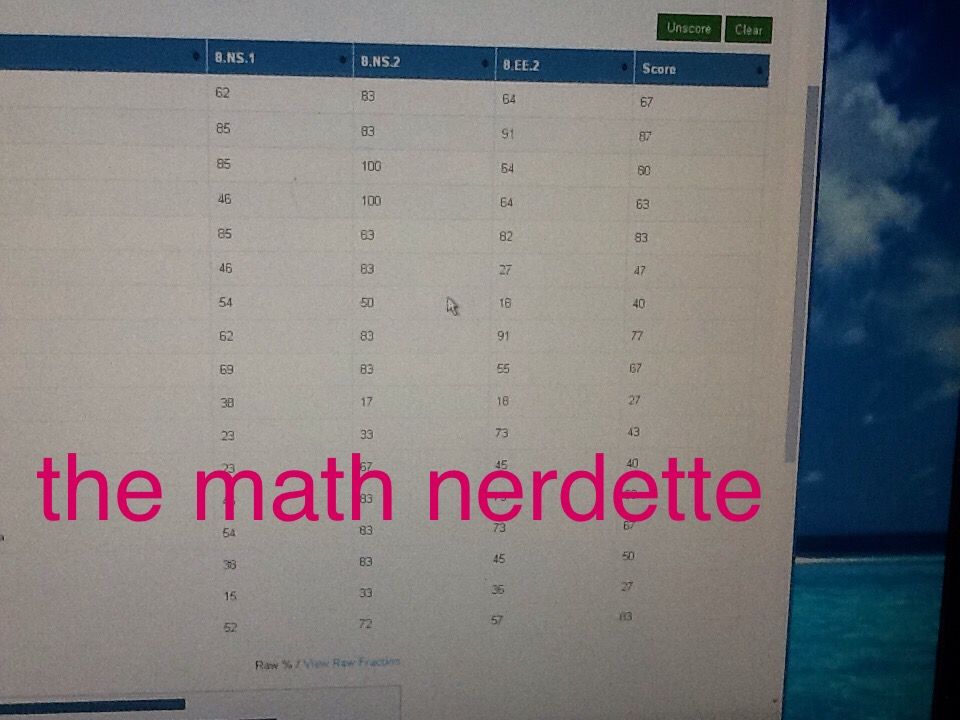
This is the results page. For each students, it gives the percentage correct for the standards picked when you first set up the answer sheet. The last percentage is the students total score. Love being able to take a quick glance to see which standards I need to review back over.
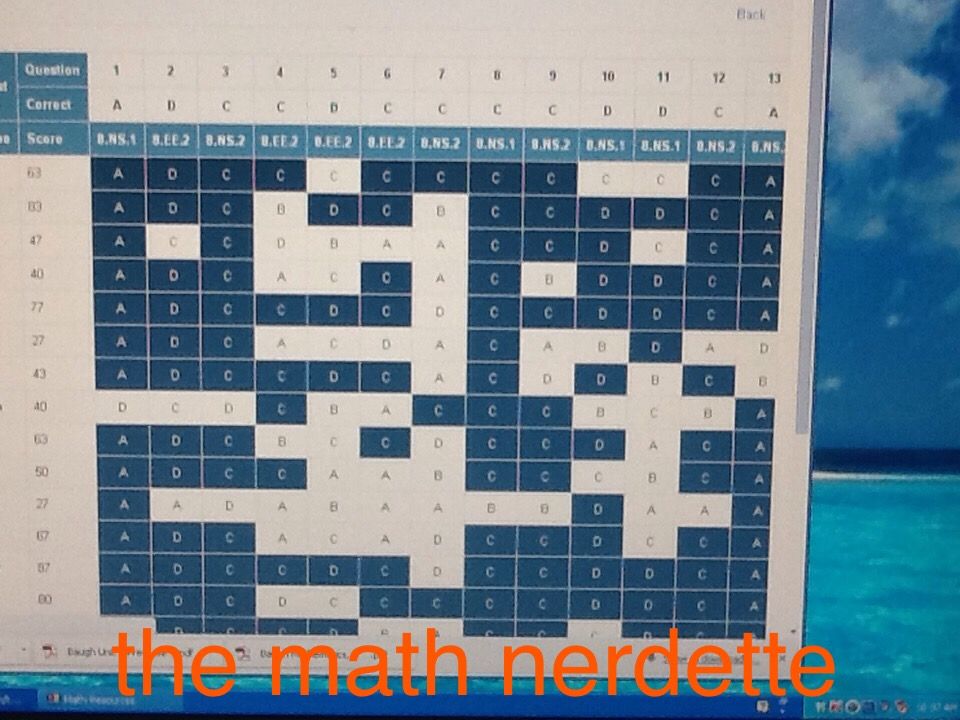
This is the item analysis. I can see that I need to go back over #7 because the majority of my class missed this question.
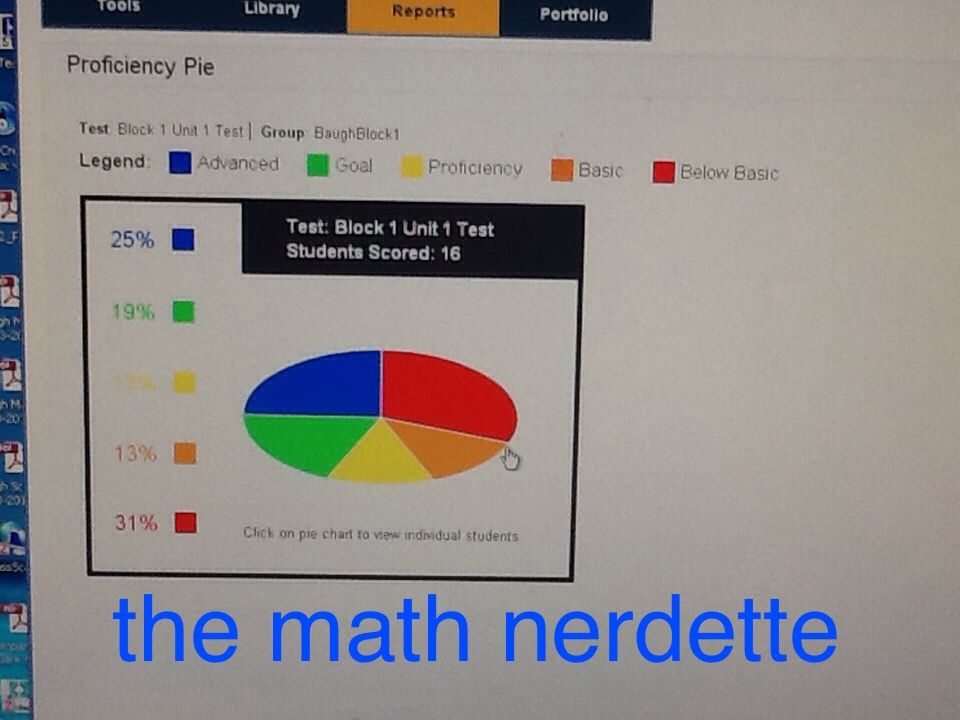
This is pie chart to comes up when you look at the proficiency. If you click on the pie graph, it tells you specifically where students fall.
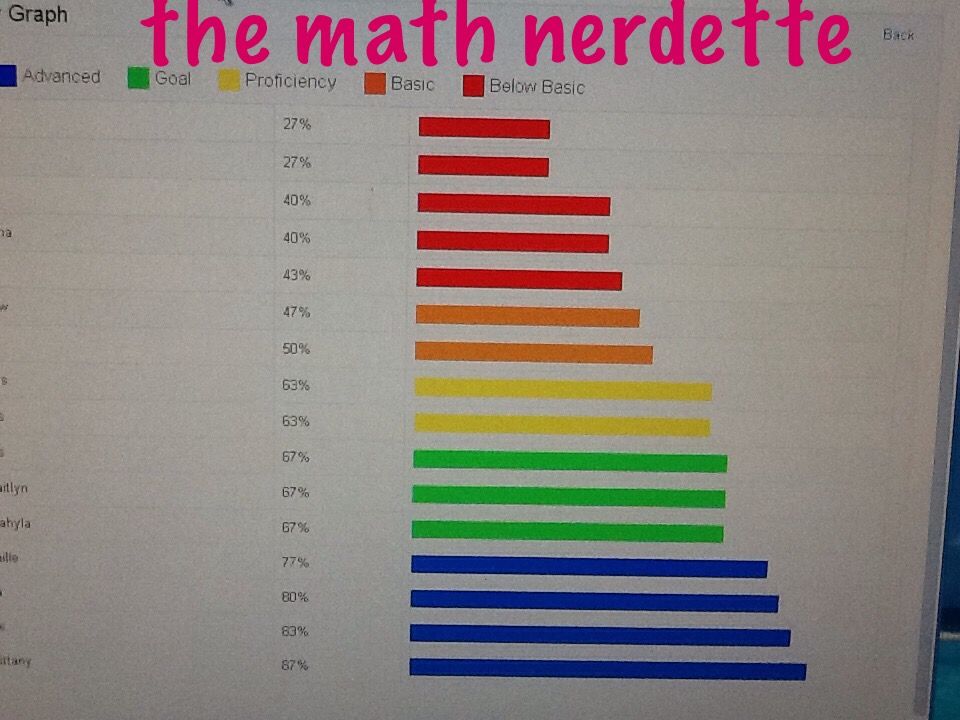
I can see from this that i need to work closely with the red, yellow, and orange students.
Using TAPit has seriously opened my eyes to a whole other side of data. It makes my life SO much easier, especially since I have my students track their data. Before I was having to sit down and figure percentages for each standard I tested on BY HAND! Now, I just set up an answer sheet and voila! It's super easy to use!
Until next time!

No comments:
Post a Comment